qcdata




Data structures for quantum chemistry inputs and results, with Jupyter visualizations.
The QC Suite
These packages work together to make quantum chemistry fast, structured, and interoperable.
- qcref - Reference data for computational chemistry: CODATA physical constants, conversion factors, a periodic table, and solvent properties, each value with its source.
- qcdata - Data structures for quantum chemistry inputs and results, with Jupyter visualizations. Documentation
- qcinf - Cheminformatics algorithms and structure utilities for qcdata structures.
- qccodec - Translates qcdata inputs into native program inputs and parses program outputs back into qcdata objects, one codec per program.
- qccompute - Runs quantum chemistry programs on qcdata inputs using qccodec codecs and returns structured results. Documentation
- BigChem - Distributed execution of qccompute calculations across clusters of computers or the cloud.
- ChemCloud - A web application and Python client that expose a BigChem cluster securely over the internet.
Installation
For a minimal installation:
python -m pip install qcdata
To install all extra feature such as cheminformatics and visualization tools:
python -m pip install qcdata[all]
You may need to put '' around the brackets in some terminals
python -m pip install 'qcdata[all]'
✨ Visualization ✨
Visualize all your results with a single line of code!
First install the visualization module:
python -m pip install qcdata[view]
or if your shell requires '' around arguments with brackets:
python -m pip install 'qcdata[view]'
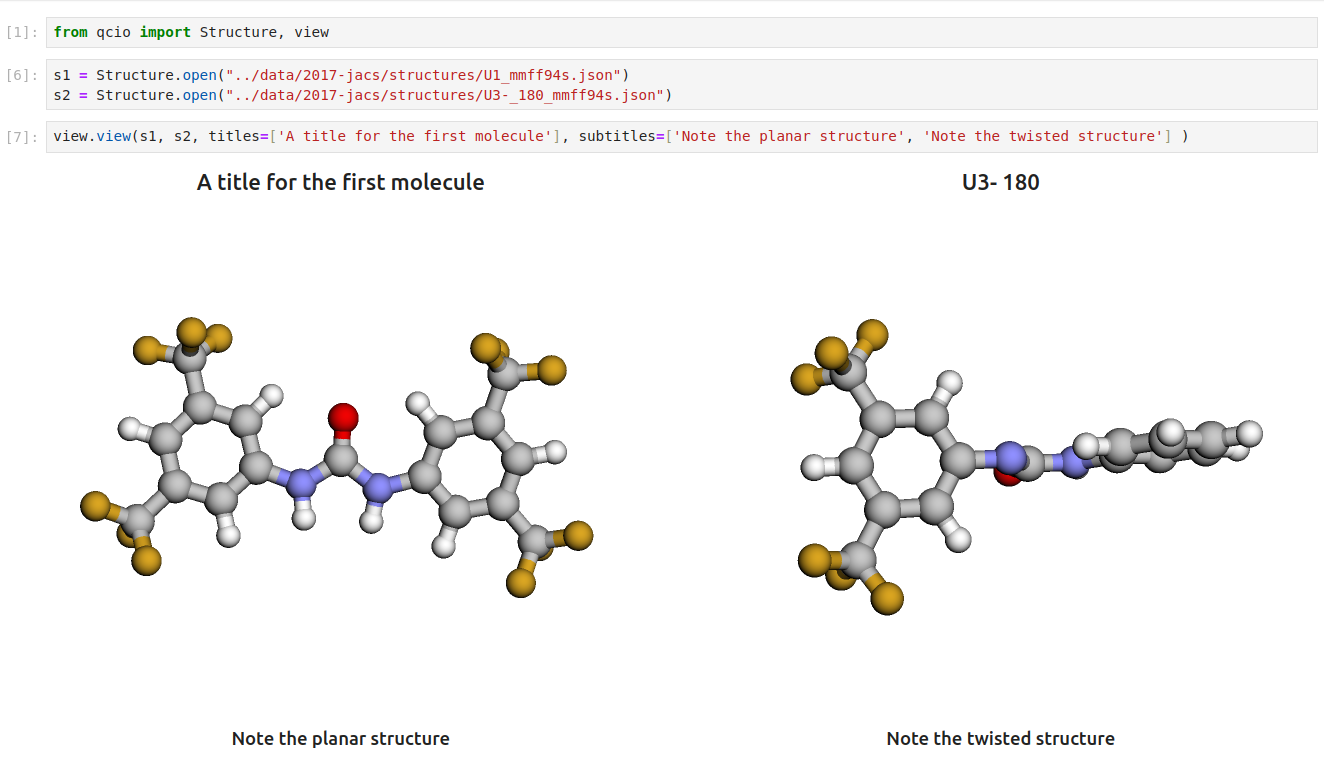
Then in a Jupyter notebook import the qcdata view module and call view.view(...) passing it one or any number of qcdata objects you want to visualize, including Structure objects or any ProgramOutput object. You may also pass an array of titles and/or subtitles to add additional information to the molecular structure display. If no titles are passed qcdata will look for Structure identifiers such as a name or SMILES to label the Structure.
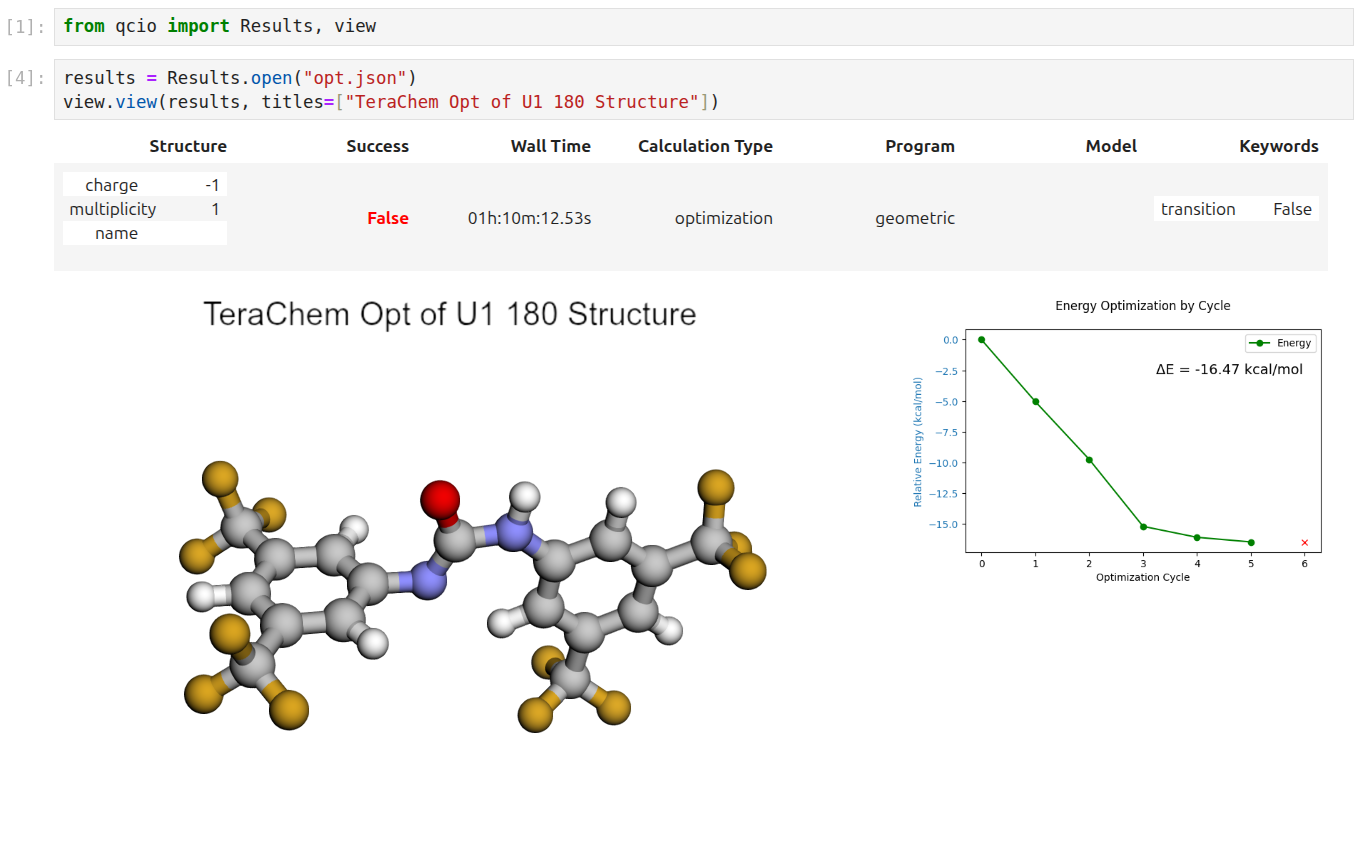
Seamless visualizations for ProgramOutput objects make results analysis easy!
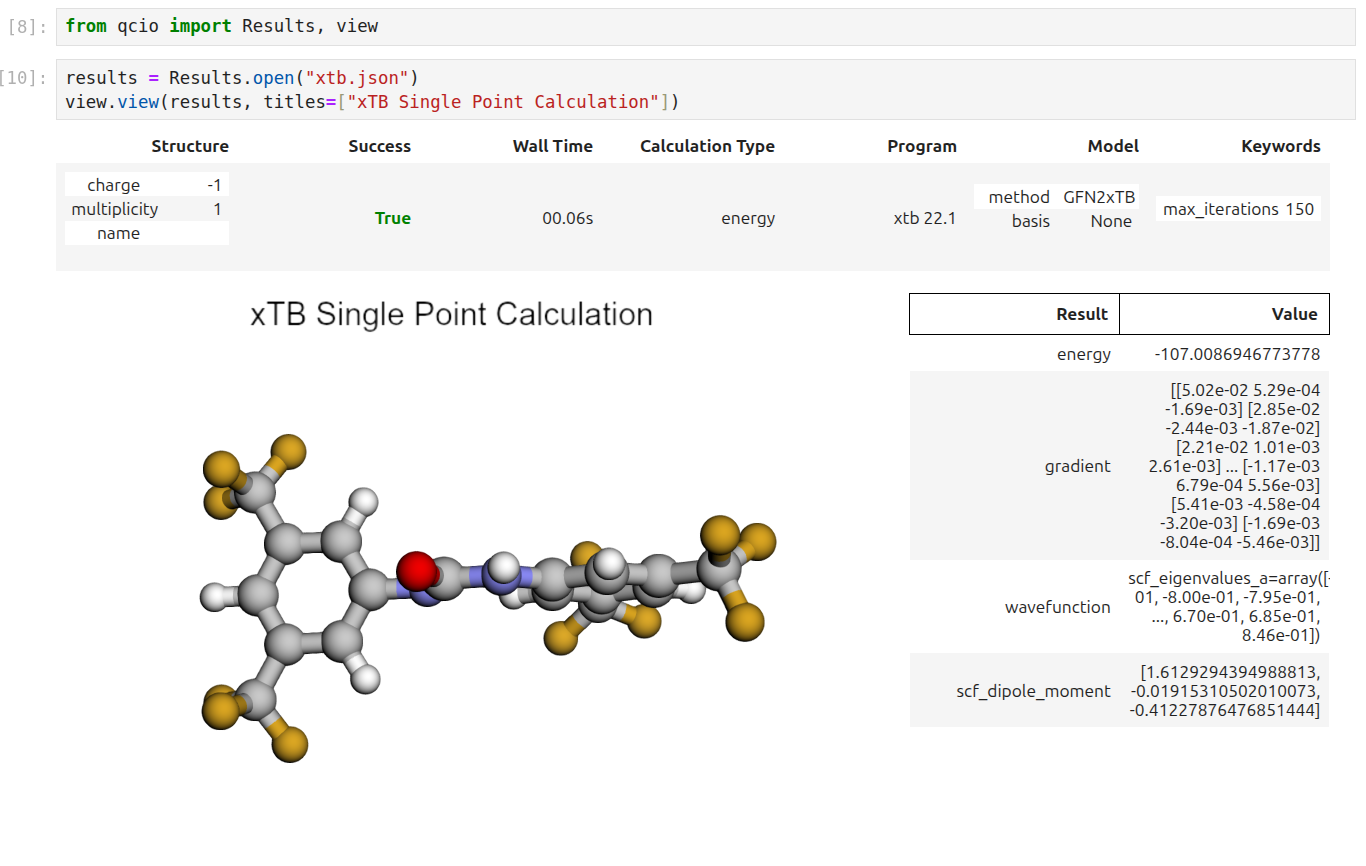
Single point calculations display their results in a table.
If you want to use the HTML generated by the viewer to build your own dashboards use the functions inside of qcdata.view.py that begin with the word generate_ to create HTML you can insert into any dashboard.
Check out the API Documentation to understand how qcdata works. Take a look at the Visualizations to see how easy it is to understand your results using qcdata!